How to Effectively Use Heatmaps
Understanding how visitors interact with your website is crucial for maximizing its performance. By analyzing user behavior, you can gain insights into areas that need improvement. One powerful tool for this purpose is a heatmap. Heatmaps help visualize which parts of your site are engaging users and which areas may require optimization. In this article, we’ll explore the fundamentals of heatmaps and how to use them effectively to improve your website’s performance. Since heatmaps provide visual data, they allow you to intuitively understand both strengths and weaknesses of your web design.
What Is a Heatmap?
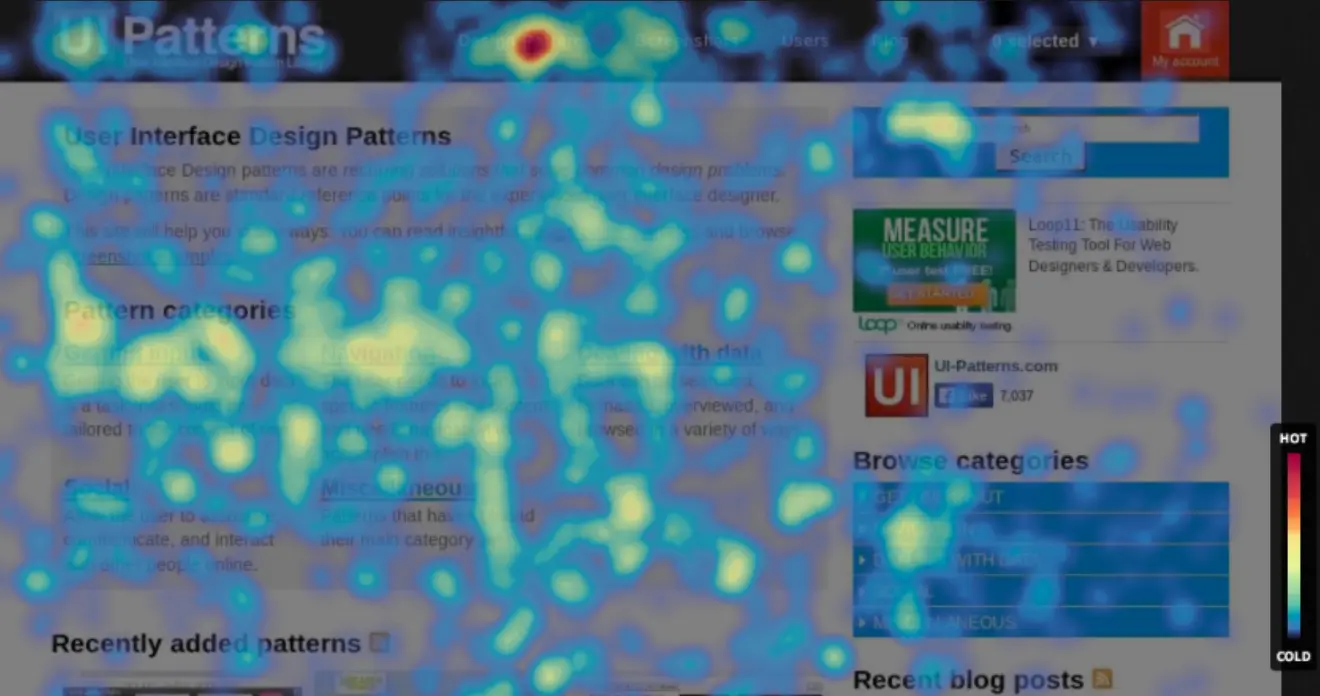
A heatmap is a visualization tool that shows where users focus their attention on a webpage. It uses color intensity—typically red or orange for high engagement and blue or green for low engagement—to indicate user interaction. This makes it easy to identify which sections of your site attract the most clicks or attention and which ones are being ignored.
Types of Heatmaps
There are several types of heatmaps, each offering unique insights:
-
Click Heatmap: Shows where users click on your page. This helps determine whether buttons and links are placed in effective locations and whether users are interacting with intended elements.
-
Scroll Heatmap: Indicates how far users scroll down a page. This reveals which sections are viewed most and where users lose interest, helping optimize content placement.
-
Attention Heatmap: Tracks where users look the most using eye-tracking technology or mouse movement prediction. This type of heatmap helps optimize layout and content visibility.
Benefits of Using Heatmaps
Using heatmaps offers multiple advantages for improving your website:
Understanding User Behavior
Heatmaps give insight into how users navigate your site. You can see which links are clicked, where users drop off, and what content holds attention. This information guides improvements in navigation, content relevance, and overall user experience.
Increasing Conversion Rates
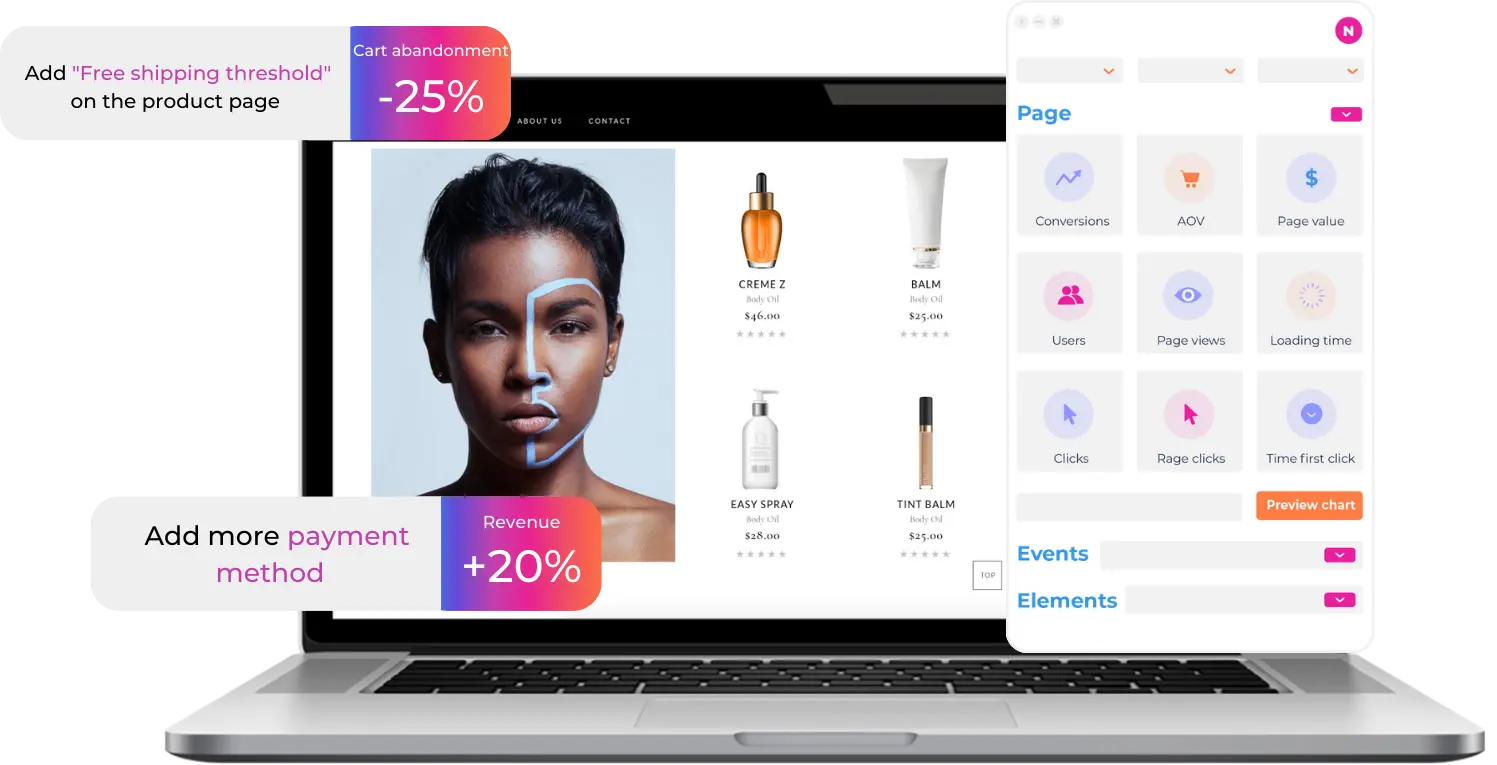
By identifying where users abandon the conversion funnel or hesitate, you can make strategic changes to guide them toward desired actions more effectively.
Optimizing Design and Layout
Heatmaps reveal how users visually interact with your site, enabling you to place key calls-to-action or important content where users naturally look. This leads to better engagement and improved usability.
How to Effectively Use Heatmaps
To get the most value from heatmaps, follow these steps:
Define Your Goals
Start by clearly defining what you want to learn from your heatmap analysis. Whether it's improving navigation or boosting conversions, setting clear objectives ensures focused analysis.
Collect and Analyze Data
Use a heatmap tool to gather data and analyze user interactions. Look for patterns such as high-click zones, ignored areas, and scroll depth to understand how users engage with your site.
Implement Improvements
Based on your findings, make targeted changes—such as adjusting layout, redesigning CTAs, or reorganizing content—to enhance user experience and drive engagement.
Measure Results
After implementing changes, measure their impact using updated heatmaps and other KPIs like bounce rate or conversion rate. Continuous testing ensures long-term success.
Choosing the Right Heatmap Tool
When selecting a heatmap tool, consider the following:
-
Ease of Use A simple, intuitive interface allows for quick setup and analysis.
-
Feature Set Ensure the tool supports different heatmap types (click, scroll, attention) and offers segmentation options.
-
Pricing Choose a tool that offers good value for your budget, especially if you're planning long-term use.
Success Story: Using Heatmaps to Improve Engagement
One company used heatmaps to revamp their homepage. Initially, users weren’t scrolling past the fold. After analyzing attention heatmaps, they moved compelling visuals and CTAs to the top of the page. This led to a significant increase in scroll depth and conversion rates. The heatmap revealed exactly where users were focusing, allowing the team to adjust the layout accordingly.
Additionally, the company optimized their content strategy based on heatmap insights, placing key information where users looked most. As a result, engagement increased across the board, directly impacting business outcomes.
Limitations and Considerations
While heatmaps are powerful tools, understanding their limitations is essential:
-
Misinterpretation of Clicks Some tools record clicks based on screen coordinates rather than HTML elements. This can lead to inaccurate results when popups or overlays are present.
-
Responsive Design Challenges On responsive websites, the same screen position might display different content on different devices. Coordinate-based tracking might not reflect actual user intent accurately.
For more accurate insights, consider UX tools like Air360, which track user interactions at the HTML element level, ensuring precise data even with dynamic layouts or overlays.
Summary
Heatmaps are an invaluable resource for understanding user behavior and improving website performance. By setting clear goals, choosing the right tools, and interpreting data thoughtfully, you can significantly enhance user experience and increase conversions. However, always be mindful of potential data misinterpretations and complement heatmaps with other analytics tools for a comprehensive view.